How this spring compares with recent April election cycles
A few housekeeping notes before we dig in.
- Our analysis runs by school year (July 1–June 30), because that better matches school district financial and state budgeting cycles. This school year is unusual: April 7 was the only election date in the 2025–26 school year to analyze. There was no election in August or November, and February primary ballots did not have any referendums. So, the school-year picture and the April picture are exactly the same.
- When we compare April 2026 to “historical” figures, we’re comparing it to other April elections specifically. April has its own personality in this dataset, e.g., different turnout patterns, different mix of districts going to ballot, and different pass rates than November or February. Apples to apples.
Let’s get to it.
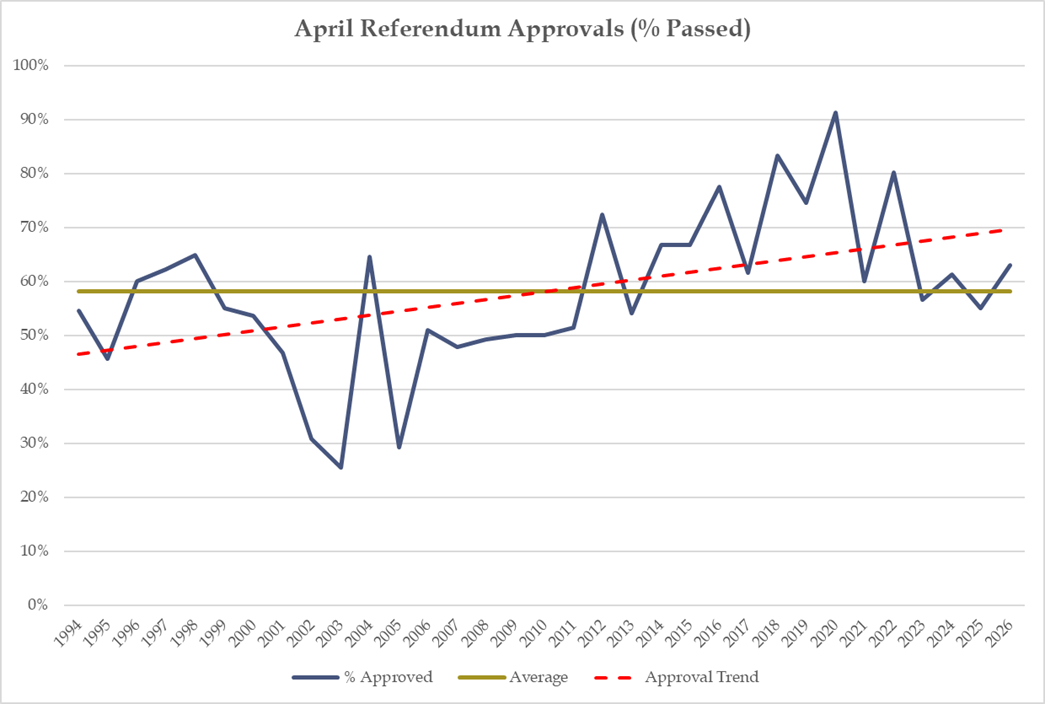
Voters approved 46 of 75 referendum questions statewide on April 7, an approval rate of 61.3%. That rate sits:
- Above April 2025’s 55.1% (49 of 89)
- Above the long-term April approval rate of 59.1%
- Below the 2011–2025 April average of 67.1%
- Below the 2016–2025 April average of 68.8%
Takeaway 1: 2026 approvals were above the long-term April norm but below recent benchmarks.
Seventy-three school districts put 75 referendum questions on the April 7 ballot. This is tied for the fifth-highest April total in our dataset, which now spans 33 Aprils. The only Aprils that had more? The last four years (2022, 2023, 2024, and 2025).
How does 61.3% stack up? It depends on your frame of reference. None of these comparisons is more “correct” than the others. They reflect different baselines:
- Long-run (all 33 Aprils since 1993): 59.1%. By this measure, April 2026 is above average.
- Post-Act 10 (2011–2025 Aprils): 67.1%. By this measure, April 2026 fell short.
- Recent decade (2016–2025 Aprils): 68.8%. By this measure, April 2026 fell further short.
Among all April elections in the dataset, April 2026 ranks 11th out of 33 by approval rate. The consistent message: April 2026 was an unremarkable result, sitting above the long-run average while falling short of the elevated rates that have characterized much of the post-2011 era.
For what it’s worth, April 2026 is a gubernatorial election year. The last two gubernatorial-year Aprils – 2018 (83.3%) and 2022 (80.2%) – had noticeably high approvals. Before those, gubernatorial-year Aprils ranged from 30.8% in 2002 to 66.7% in 2014. April 2026’s 62.7% is closer to that longer-run pattern.
Takeaway 2: Operational referendums dominated the ballot in a way we haven’t seen before.
Of the 75 questions on April 7 ballots, 57 were non-recurring operational referendums (76% of everything voters saw). That is, by a wide margin, the highest share of any April election in our dataset. The previous high was April 2025, at about 60%. Before 2026, the average April ballot share of non-recurring referendums was about 34%.
A quick reminder on types:
- Capital referendums (DI, or debt issuance) allow a school district to borrow money to pay for facility improvements.
- Non-recurring operational referendums (NR) provide additional funding for daily operations (staffing, transportation, utilities), but the funding expires after a set number of years.
- Recurring operational referendums (RR) provide operational funding that doesn’t expire.
Here’s how each fared this spring:
- DI: 9 of 12 passed (75.0%)
- NR: 32 of 57 passed (56.1%)
- RR: 5 of 6 passed (83.3%) – Big asterisk here. With only six questions, we’d caution against reading too much into that percentage. Districts are also often highly selective about when they bring a permanent property tax increase to ballot, which affects the denominator in ways that aren’t fully visible in a pass rate alone.
Combining NR and RR, voters approved 58.7% of operational questions versus 75.0% of capital questions. Capital outpaced operational this spring.
The surge in non-recurring referendums isn’t a coincidence. It reflects the ongoing squeeze on school district operating budgets under Wisconsin’s revenue limits. When districts can’t cover daily expenses within their revenue cap, they turn to voters. The fact that three out of every four questions on April ballots this year were operational in nature underscores where school finance pressures are concentrated right now.
Takeaway 3: Regardless of referendum type, more questions passed than in 2025, but the dollar-share stayed nearly the same.
The approval rate and the dollar-share approved don’t always move together, and this spring is a good illustration of why that distinction matters.
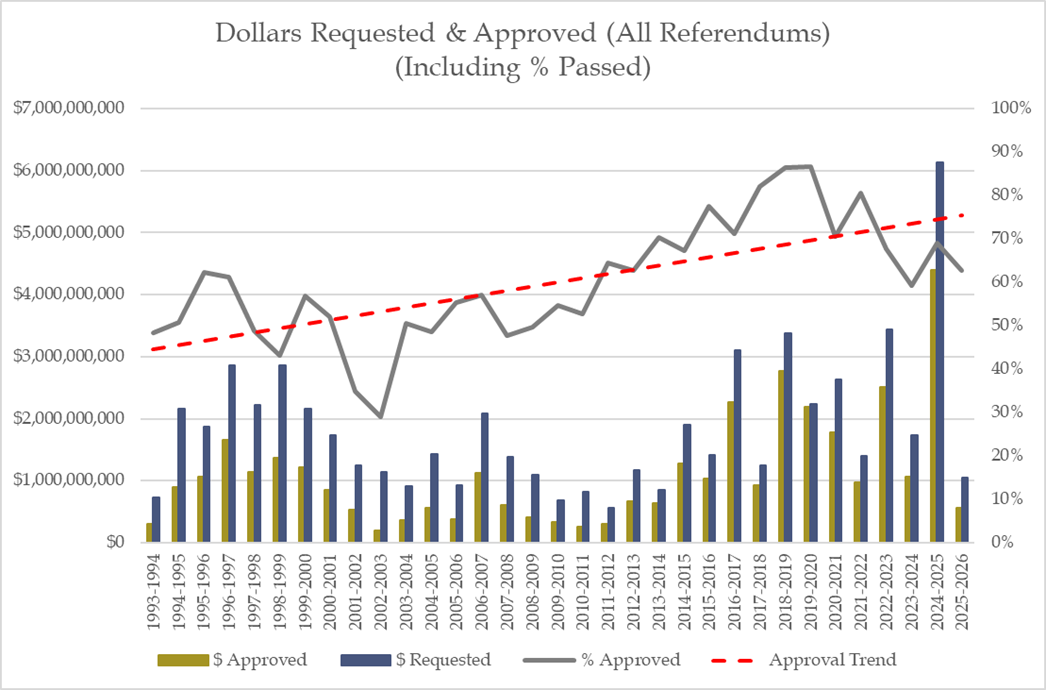
School districts collectively asked for about $1.047 billion in April 2026. Voters approved approximately $565 million, or 54% of requested dollars.
Compare that to April 2025: 55.1% of questions passed, and 55.6% of requested dollars were approved. In April 2026, 61.3% of questions passed, a meaningful increase, yet the dollar-share approved (54%) is essentially flat.
That distinction matters because it suggests the increase in question-level passage did not automatically translate into a proportionally larger share of total dollars being approved. Voters appear to be applying more scrutiny to larger asks even as they’ve become more willing to approve smaller or more targeted ones.
To put the $1.047 billion request in context: among the 33 April elections in the dataset, April 2026 ranks 7th-highest in dollars requested. While it trailed the exceptionally large April ballots of 2024 and 2025, it still sits among the larger April request totals in the dataset. Ballot composition helps explain part of that story: non-recurring operational referendums tend to be smaller asks than capital projects, and when three-quarters of the ballot is operational, the aggregate figure will naturally be lower than in heavily capital-driven years, even when the number of questions is high.
Takeaway 4: Many referendums passed by just a few votes. Many referendums failed by just a few votes. Results were close on both sides of the finish line.
School districts need 50% + 1 vote for a referendum to pass. In April 2026, 13 of 75 referendums (17.3%) landed in the 48–52% range. Of those, 7 passed and 6 failed.
For comparison, April 2025 had 28.1% of its questions in that same range, a considerably more compressed result. April 2026 was less compressed than last year, but it still had plenty of outcomes that could have gone either way:
- Shell Lake passed at 50.07%
- Butternut passed at 50.09%
- Gilman passed at 50.33%
- Sauk Prairie (RR) failed at 49.64%
- Montello failed at 49.41%
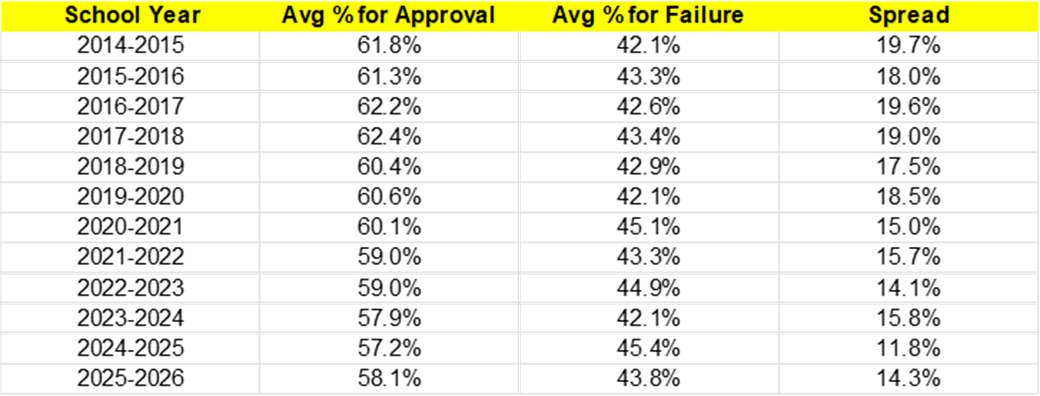
Referendums that passed in April 2026 averaged about 58% “yes” support — a bit below the historical April average for passing referendums, which is just under 60%. Referendums that failed averaged about 44% “yes” support — slightly above the historical April average for failed referendums, which is just above 41%.
In plain terms, the referendums that passed did so with a thinner margin than usual, and the referendums that failed were not as decisively rejected as they have been historically. The middle ground was crowded.
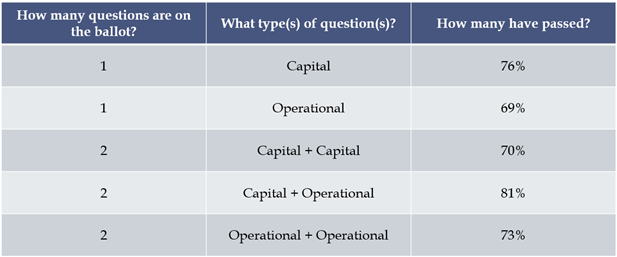
Takeaway 5: This cycle didn’t do much to clarify what happens when a district puts two questions on a ballot at the same time.
Since September 2017, Wisconsin school districts have been limited to two referendum questions per calendar year. That makes ballot structure an increasingly relevant area to watch.
In April 2026, only two districts placed more than one question before voters:
Howard-Suamico brought both an NR and a DI question. Both passed (53.4% and 55.5%, respectively).
Sauk Prairie brought an RR and a DI question. Both failed (49.6% and 47.1%, respectively).
With only four total questions from two districts, this sample is far too small to draw further conclusions about what the effects of this are. Instead, take a look at this analysis from last spring (when April was the only major election date of that calendar year).
First, the questions are often paired, e.g., building a pool (capital) and operating the pool (operational). When one goes down, the other goes down with it. Thus, if I like the project, I like both questions. If I don’t, I don’t like both questions. Voters still see them as a package.
Second, you’re likely to make each question cheaper if you know it has to compete. In other words, if you were planning to ask for, say, $50 million in capital improvements, but you then determine you also need an operational referendum, maybe you lower the ask to a more palatable $20 million.
Third, you might split the yes-vote in two, but there might be just enough double-yes voters to get them both over the finish line. Take this fictional but realistic example. Maybe if a district had put a single $50 million question on the ballot, it would have garnered 60% support. Maybe if that same district put a single $10 million operational referendum on the ballot, it would have garnered 58% support. Now, that same district puts both on the ballot. Some people can’t afford both. So, they choose one, and each garners 51% support. Sure, both pass, but it’s a much bigger gamble.
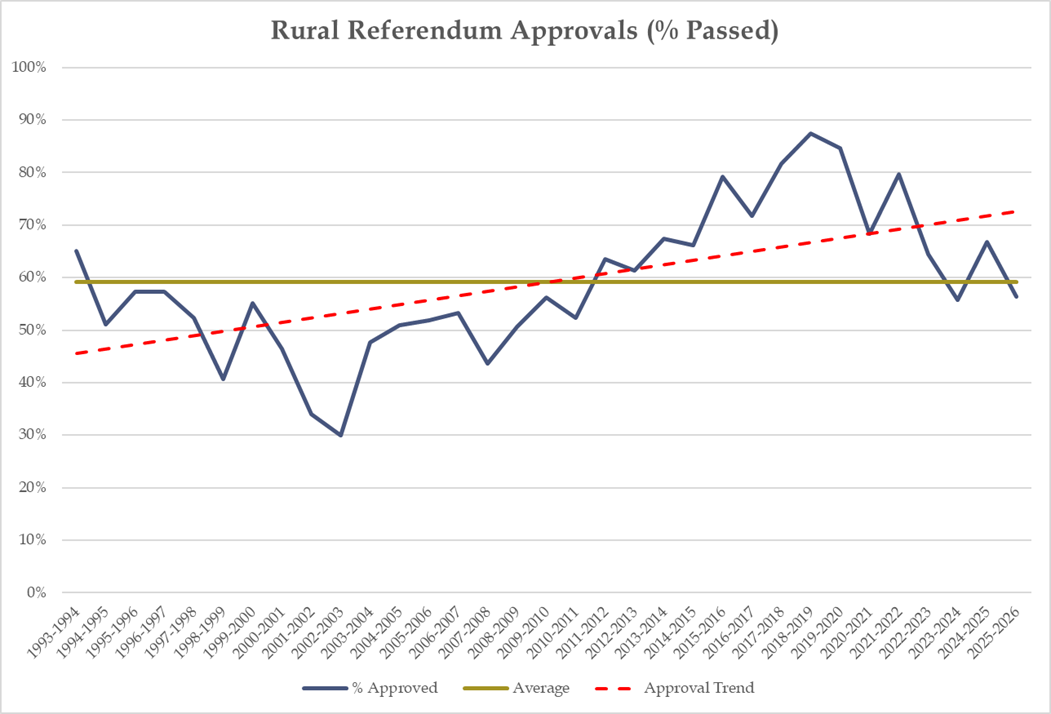
Takeaway 6: The statewide result was shaped primarily by rural ballot volume
The overwhelming majority of Wisconsin school districts are rural, so the statewide picture tends to mirror the rural picture closely.
Of the 75 statewide questions:
- 64 came from rural districts – passage rate of 59.4%
- 9 came from suburban districts – passage rate of 88.9% (8 of 9, though with only 9 questions, interpret with care)
- 2 came from urban districts – one passed, one failed
Rural districts drove the statewide result. The suburban and urban denominators are small enough that a single, different outcome would meaningfully change those percentages. When you see a “statewide” figure, it’s largely a reflection of what happened in rural Wisconsin this April.
A note on what to watch
The shift toward operational referendums – and away from capital ones – is worth keeping an eye on as more data comes in. Compared with the earlier years of the dataset, April ballots in recent years have shifted much more heavily toward operational asks. This April represents the most extreme version of that shift yet.
Whether that’s a one-year anomaly or part of a longer structural change in how districts are using the referendum process is a question the next few election cycles should help answer. You can learn quite a bit about the state of school finance in Wisconsin just by watching which type of question is on the ballot.
Questions? Reach us at research@schoolperceptions.com
The School Perceptions Resource Center features the voices of our team members. This post was written by Rob DeMeuse, Vice President of Research.